Data Vandals, for the Office of Mayor Karen Bass · INITIAL DATA ANALYSIS
WHAT DOES LA love?
Nineteen days of participatory posters from the City's World Cup watch parties, decoded to create a portrait of how Angelenos see their city ahead of the 2028 Games.


3,914
Votes
103
Comments
5
Parks
19
days
Why it matters
Love is civic data too
Cities already track what needs fixing through 311 calls and service requests, but they rarely track what residents love and feel attached to. The City of Los Angeles Mayor’s Office partnered with Data Vandals to create a new kind of civic dataset: one that asks Angelenos what they love, how they want to connect, and what their hopes are for their city – especially as the City prepares to host the Olympic and Paralympic Games in 2028.

THE WORLD CUP IN LA
What is kick it in the park?
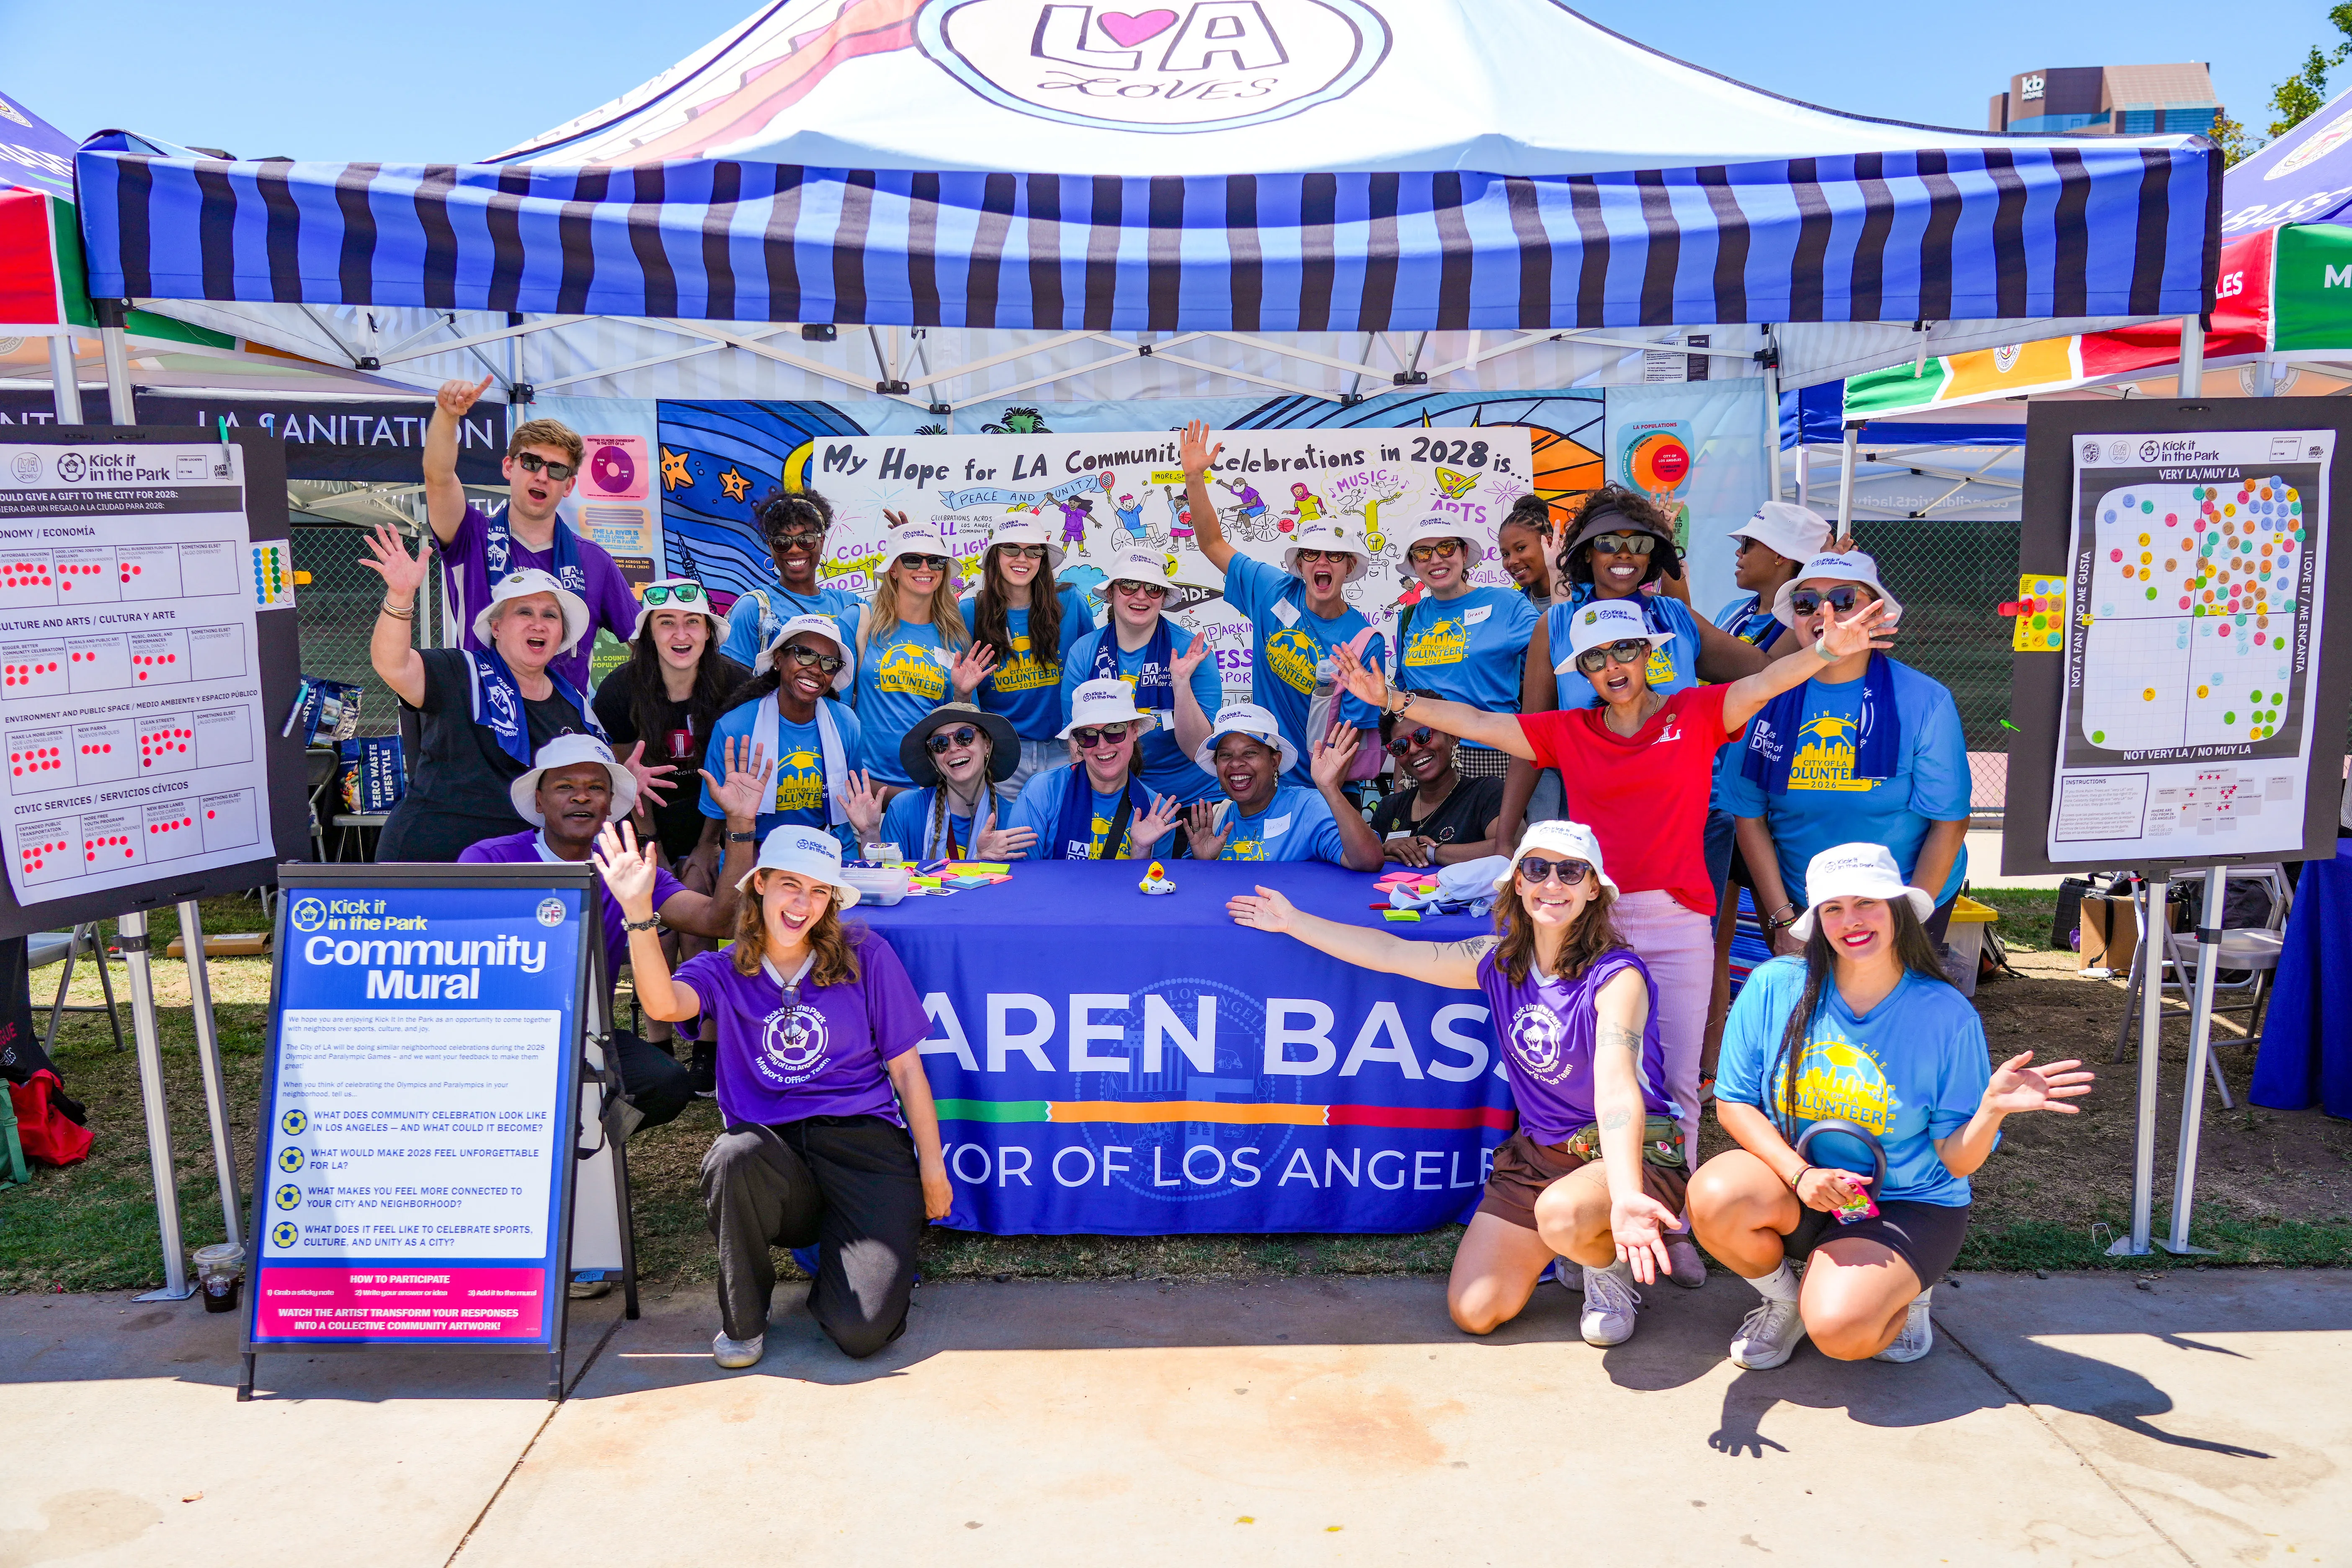
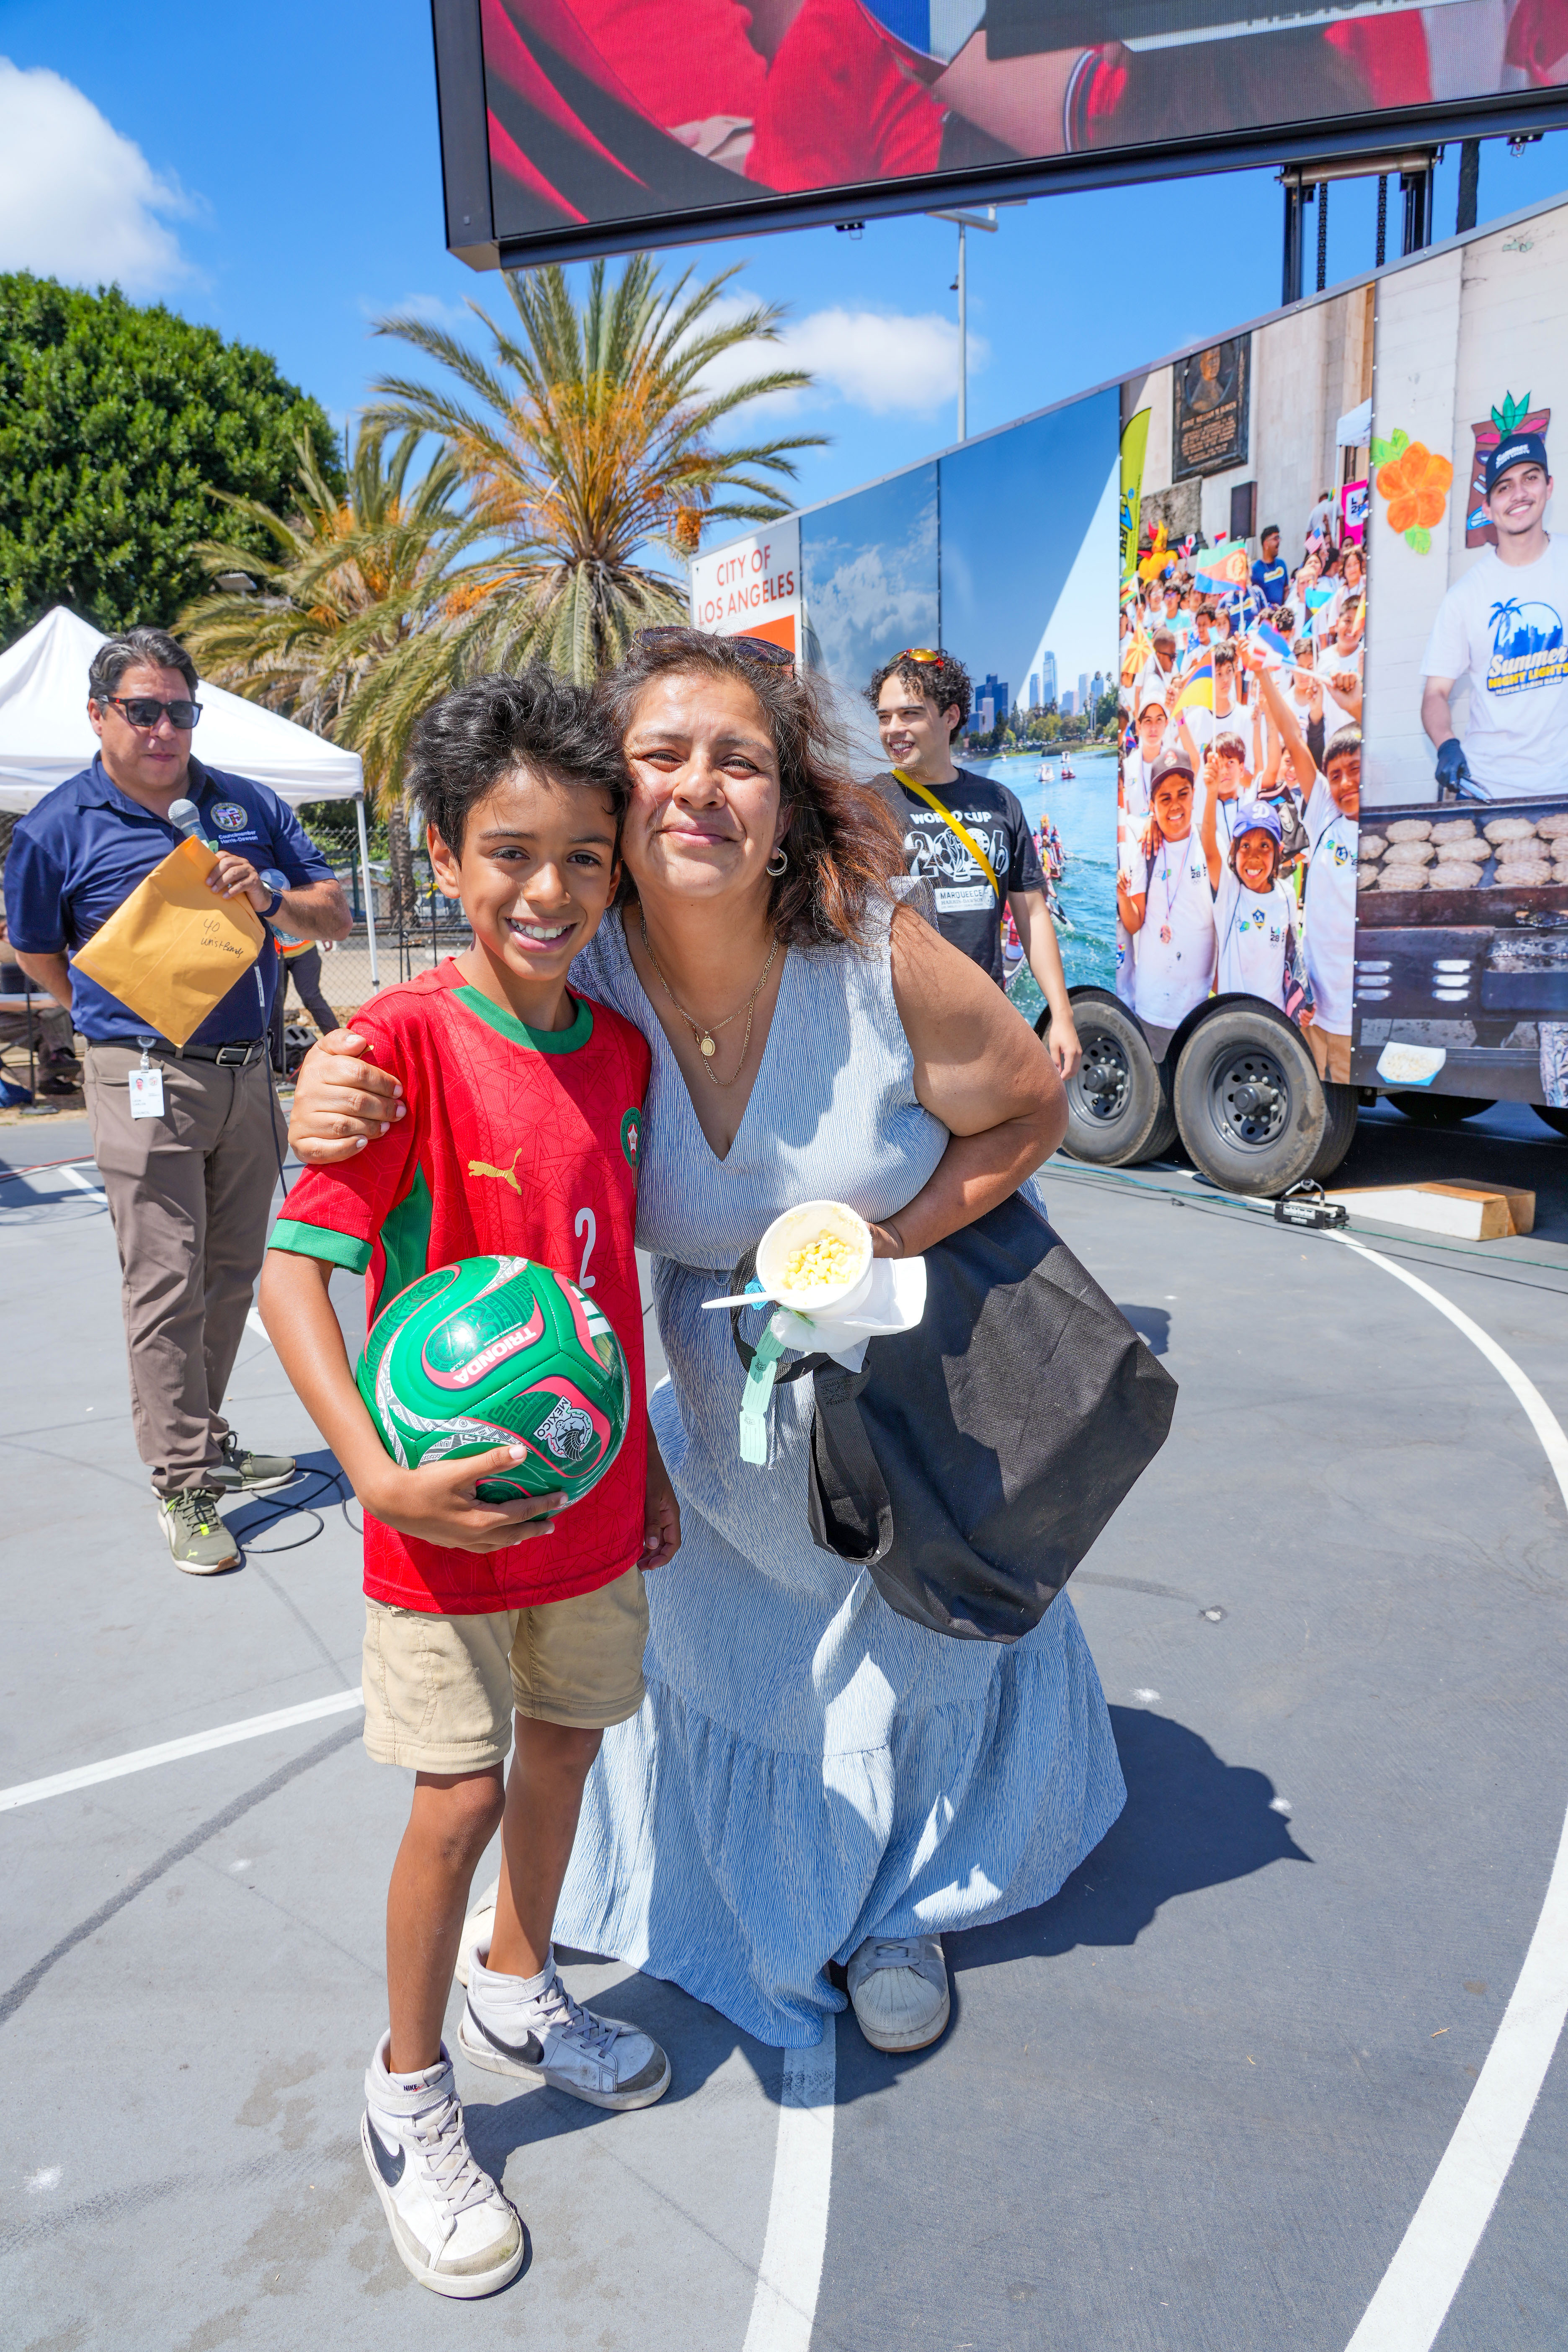
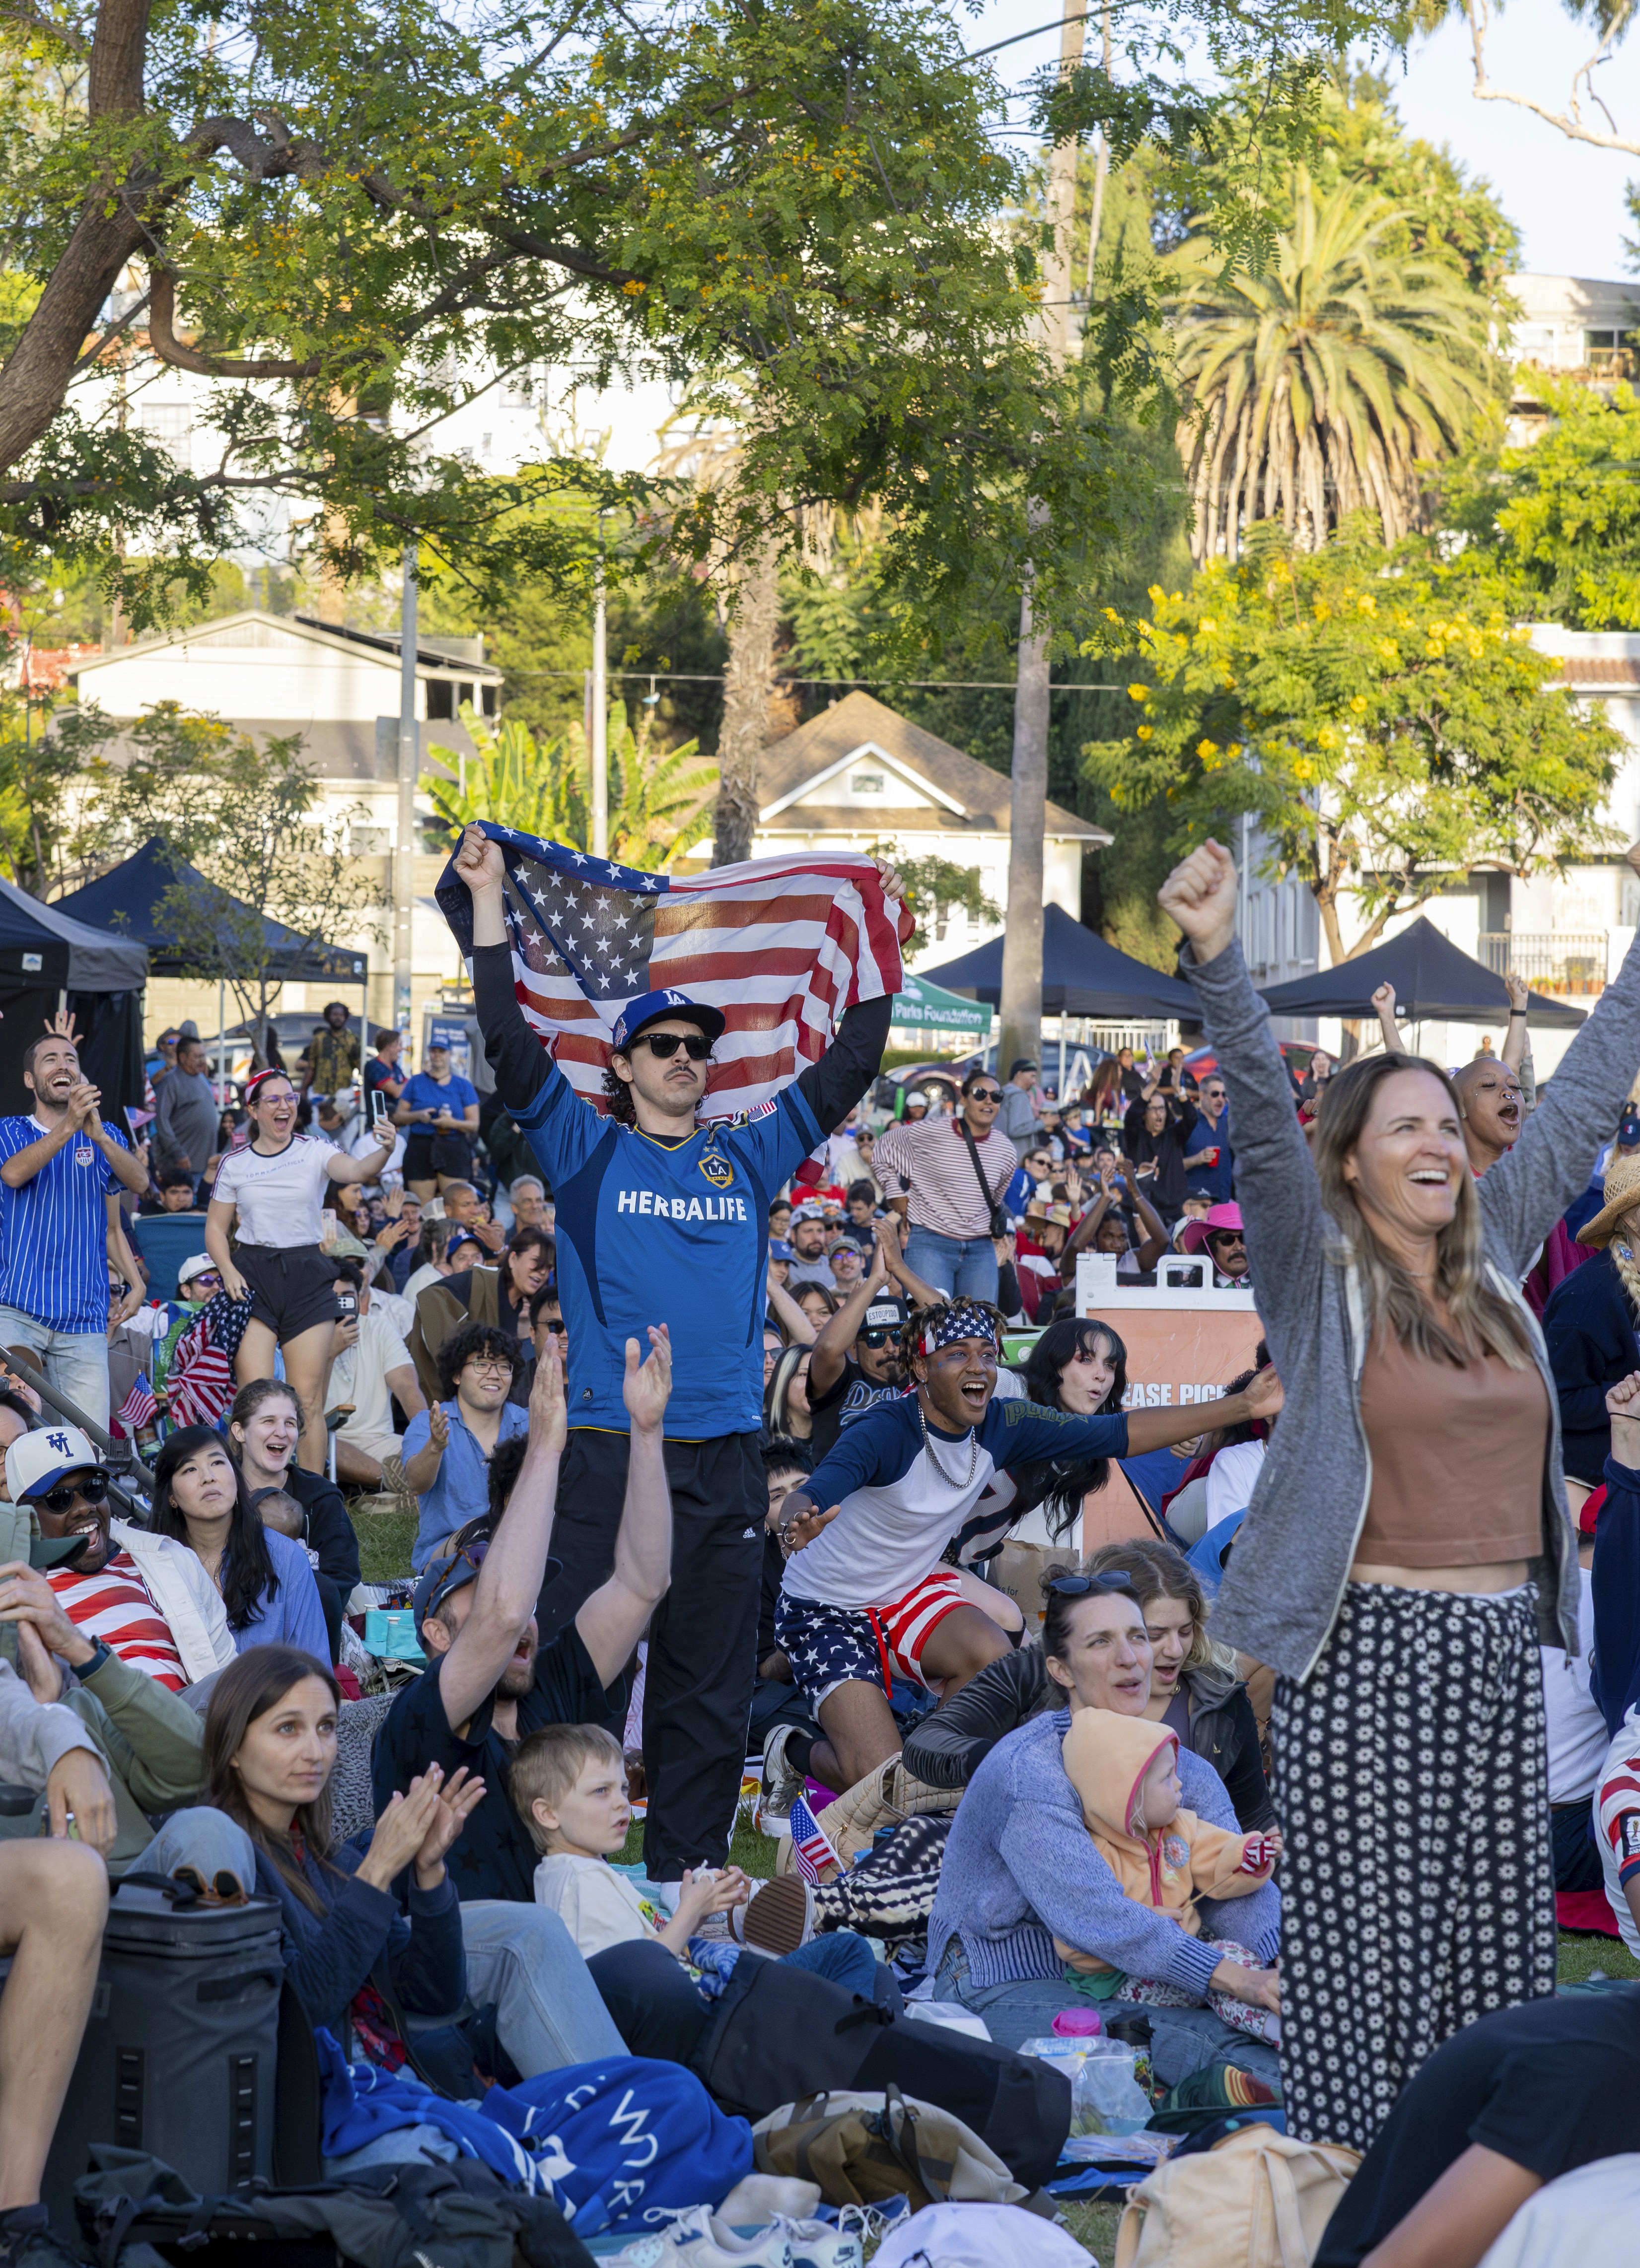
Throughout the months of June and July, the city hosted Kick It in the Park, a series of 109 World Cup watch parties in parks across Los Angeles. The LA Loves team saw these gatherings as an opportunity to survey passionate Angelenos in the community while creating an engaging activity for fans to participate in outside of the games.






Who are the data vandals?
The Data Vandals are data-artists that present data in exciting new ways, stopping people in their tracks and inviting them to learn more. LA Loves was a partnership between the Mayor's Office of Strategic Partnerships and Data Vandals to create a series of surveys for the Kick It In the Park World Cup viewing parties. This month-long, citywide celebration of what Angelenos love turns everyday opinions into vivid, participatory data at parks across Los Angeles from June 11–July 19.


what is the la loves booth?
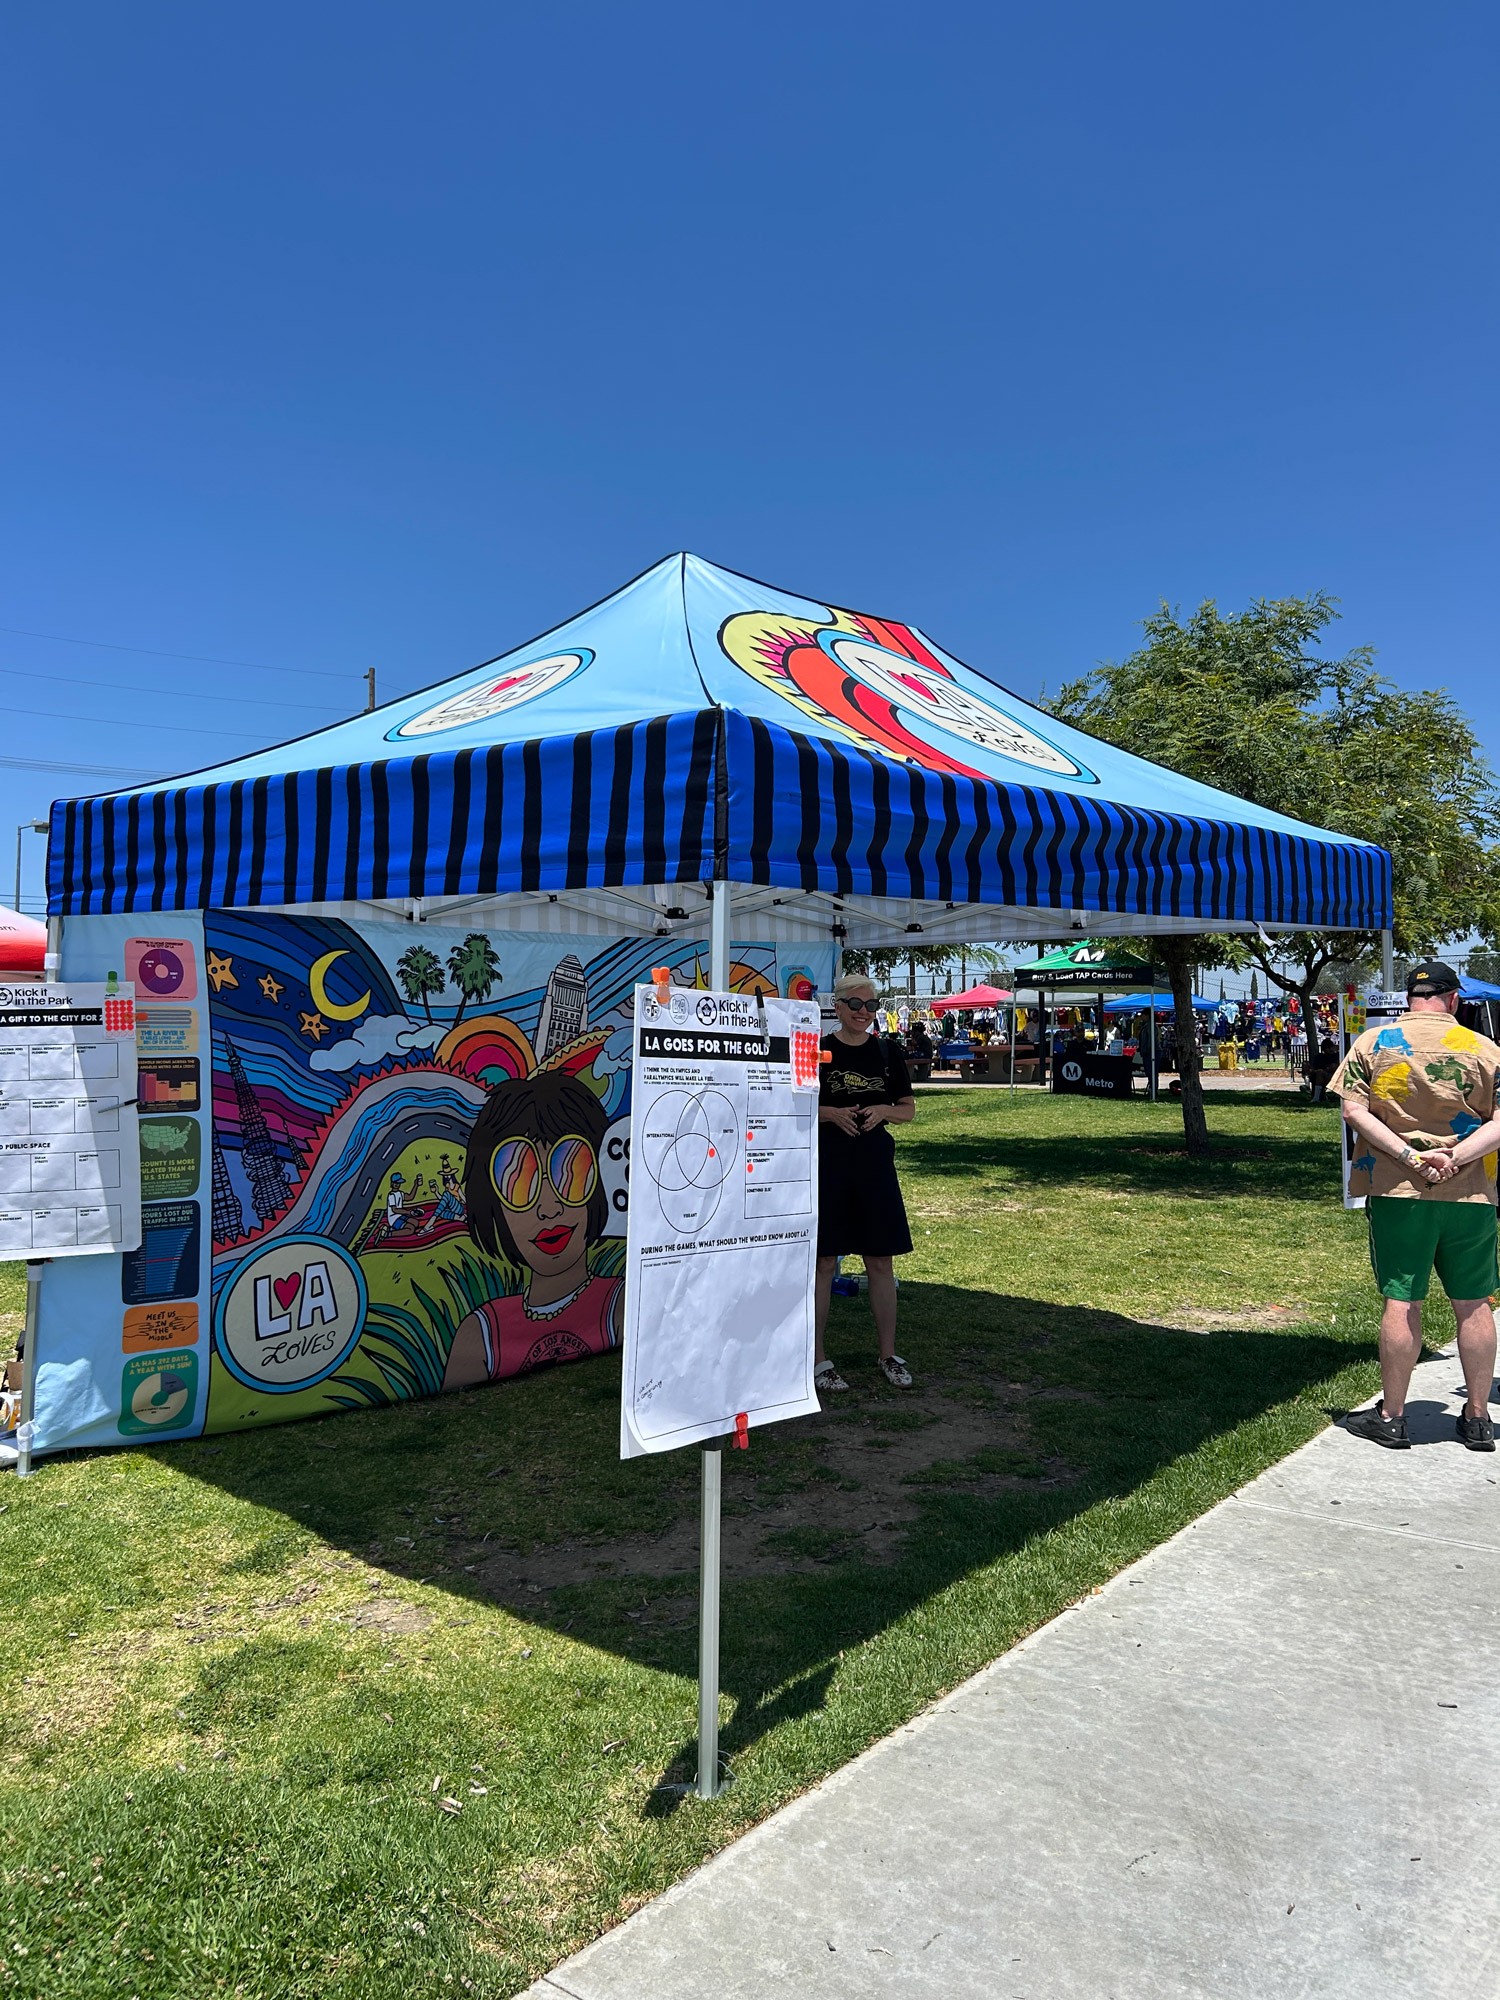
The LA Loves booth conducts a 4-part survey that builds a new planning dataset for the City of Los Angeles, supporting future community celebrations, including preparations for Super Bowl LXI and the 2028 Olympic and Paralympic Games. By making this planning data visible and fun, LA Loves helps residents see how their individual opinions can actively shape large-scale civic events.



Survey Design
FOUR POSTERS
The four survey posters each collect a different slice of “what Angelenos love,” so together they turn quick, fun interactions at the tent into a structured dataset the city can use for long‑term planning.
Hover over the posters to see more!


Across the set, the posters move across topics – what do Angelenos love and view as quintessentially LA, what “gift” they would give to the city for 2028, what they’re most excited about in the 2028 Games, and what volunteer opportunities they’d be interested in. Because everything is collected through playful, visible interactions, people can literally see their data accumulate on the posters, reinforcing the idea that their tastes and priorities are shaping real decisions about LA's civic life.
REGIONS IN LA
WHO DID WE HEAR FROM?
Sites rotated across council districts over the nineteen days. Of 202 people who marked their neighborhood, the largest groups came from the San Fernando Valley (41) and Central LA (32), with a notable share from outside the city entirely (24).
Bar
Geographic
regions of survey participants
Survey Poster 01
WHAT DOES LA LOVE?


The LA Loves matrix poster invites people to place stickers to show how much they love or dislike classic LA subjects, turning the board into a colorful map of what feels most—and least—like Los Angeles.
The sticker sheet offers illustrated categories: Dodger Mania, the LA River, Palm Trees, Murals, Public Transit, Street Vendors, Celebrity Sightings, Perpetual Summer. We also added a “write in your own” blank sticker, and a red star for “Where are you from?”, so each person can tag the part of the city they call home.
Summary of sticker votes
Street Vendors and Murals lead on affection and the LA identity, with Perpetual Summer and Palm Trees close behind. Dodgermania is the most LA at but only three in five love it, Celebrity Sightings rank last on loved, and the LA River splits evenly at 52%. Public Transit is the outlier: lowest on identity at 38%, but 64% love it and it topped civic priorities.
Some things LA agrees on, Others Differ By neighborhood
Each dot is one poster session, so the spread shows how much the answer changed from park to park.
Survey POSTER 02
A GIFT TO THE CITY
We split the question “What gift would you give to the city for 2028” into four categories: economy, culture, environment, and civic services. Each category received roughly the same amount of participation. But within each one, people were decisive about their priorities.
economy
culture
civic services
environment
What we learned:
01
Economy: In the midst of a celebration, people still Discussed affordable housing
learn more
02
Culture: Community celebrations Are prized by Angelenos
learn more
03
Civic Services: Transit leads, but youth programs are a strong second
learn more
04
Environment: LA wants greener, cleaner streets
learn more
A sample of responseS:
"For a regional / communal shelter system"
ECONOMY
"Homes for all; tax on vacant homes; commercial vacancy tax"
ECONOMY
"Block partys"
CULTURE AND ARTS
"Downtown Development"
ECONOMY
"More trees, especially in the valley"
ENVIRONMENT AND PUBLIC SPACE
"Movies @ Echo Park"
CULTURE AND ARTS
"Language access"
CIVIC SERVICES
"Plant more trees, Fix our sidewalks!"
ENVIRONMENT AND PUBLIC SPACE
"Build more shade!"
ENVIRONMENT AND PUBLIC SPACE
"Soccer fields (with turf)"
ENVIRONMENT AND PUBLIC SPACE
Survey POSTER 03
LA goes for the gold
We asked Angelenos what they were most excited about for the 2028 Olympic and Paralympic games, and celebrating with their community beat the sports competition itself… even at a sports watch party.
Responses to "When I think about the Olympics, I'm Most Excited about…"
WRITTEN Responses By Category
Responses to "What Should The World Know ABout LA?"
Survey POSTER 04
volunteer
99% of people who answered want to volunteer for LA. Only one person, out of 88, said they weren't interested. But 56% said they either only kind of know how to get involved, or don't know at all.
How often would you WANT TO VOLUNTEER?
HOW WOULD YOU VOLUNTEER FOR YOUR CITY?
Three numbers for the record:
99%
INTERESTED IN volunteering
45%
picked transit as top civic priority
38%
most excited about celebrating with their community
so how do you get involved?
LA has tons of options for getting involved in your community. First, let’s start with the City. You can find volunteer opportunities across city departments here. If you’re particularly excited about the Major Events, sign up for ShineLA to help prepare our community to step onto the global stage; and sign up for our 2028 Games City Volunteer Program when it goes live in 2027.

There are also plenty of great options directly in our neighborhoods: Make an account with LA Works to explore non-profits volunteer opportunities across the county.
Project FINDINGS
SUMMARY
How do you have a conversation with a city? This is the start of an answer. Data Vandals will keep collecting, digitizing, and reflecting this data back to Angelenos and to the city, through 2028 and beyond.
Transit is loved, but doesn’t feel like LA (yet)
64% love it, but only 38% call it “very LA,” and 45% picked it as their top civic-services priority. This is a great opportunity as the City pursues a transit-first 2028 Games.
ANGELenos are proud of is multicultural CITY
When asked what the world should know, diversity and immigrant pride dominated. Comments on diversity, the city’s multitude of different cultures, and its food scene beat out all other topics. As the City prepares to welcome the world for the 2028 Games, it’s clear that its diversity and culture should take center stage!
LA WANTS TO VOLUNTEER. PEOPLE just need TO KNOW HOW.
99% are not opposed to volunteering for the city or other organizations, yet 56% don't fully know how to get involved. As we approach the Games, building a culture of service is a top priority, and the City is committed to helping Angelenos who want to get involved in their communities.
Angelenos are excited to celebrate the games in their community
LA is eager for a Games for all, where neighbors can celebrate civic joy together – they want more watch parties, celebrations, and chances to connect.
Strip away the caveats and one thing is unmistakable: this is a portrait of a city that wants in. Angelenos crowded the tables, argued affectionately about the Dodgers, and told us — 99% of them — that they're ready to serve. LA Loves started as a hunch, that you could have a real conversation with a city using stickers and a tent in the park; ten days, 3,914 votes, and 19 sites later, that hunch holds. Every finding here points at something the larger project is built to solve — the transit gap, the navigation problem, the multicultural pride waiting for a stage.
How'd we do it?
methodology
Data Collection
Data were collected via four sticker-based response posters administered at Kick It in the Park watch parties across five park sites in Los Angeles during June 2026. Participation was voluntary and self-selected. Respondents affixed adhesive stickers to physical posters to register categorical responses, with each sticker constituting one vote irrespective of color, except where color denoted response category (LA Loves poster only). Handwritten comments and open-ended write-in responses were also collected where the posters provided for them.
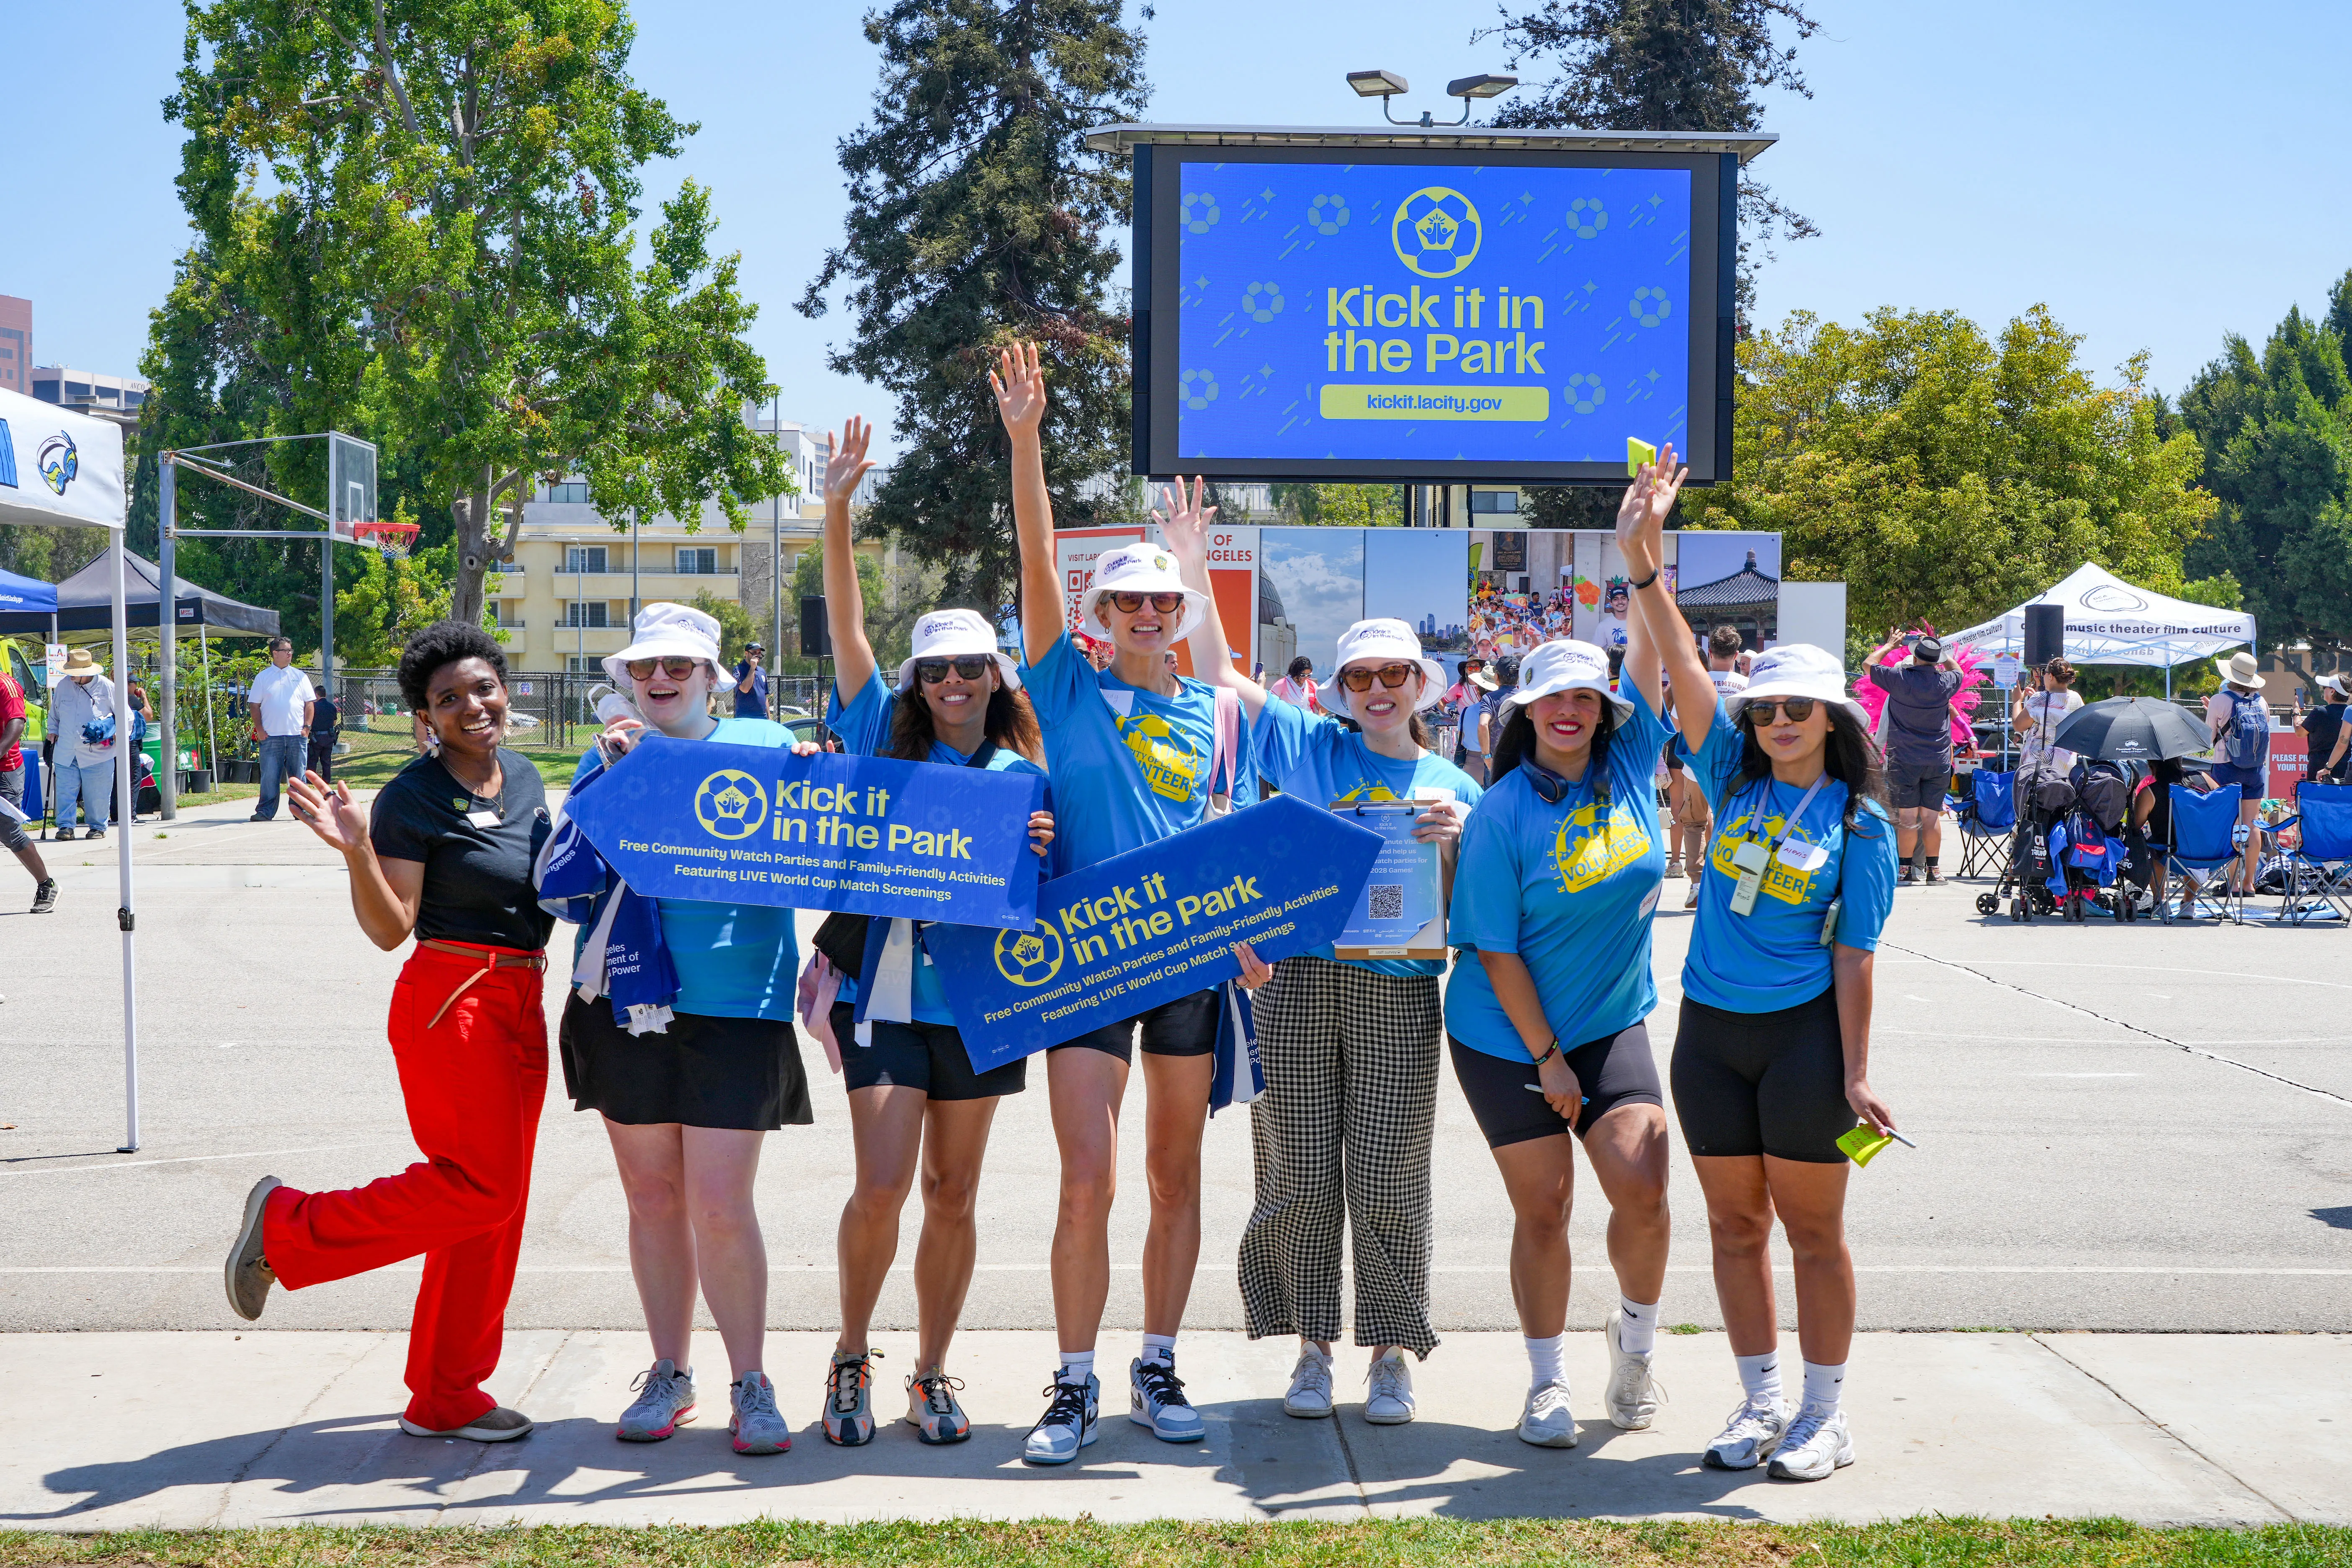
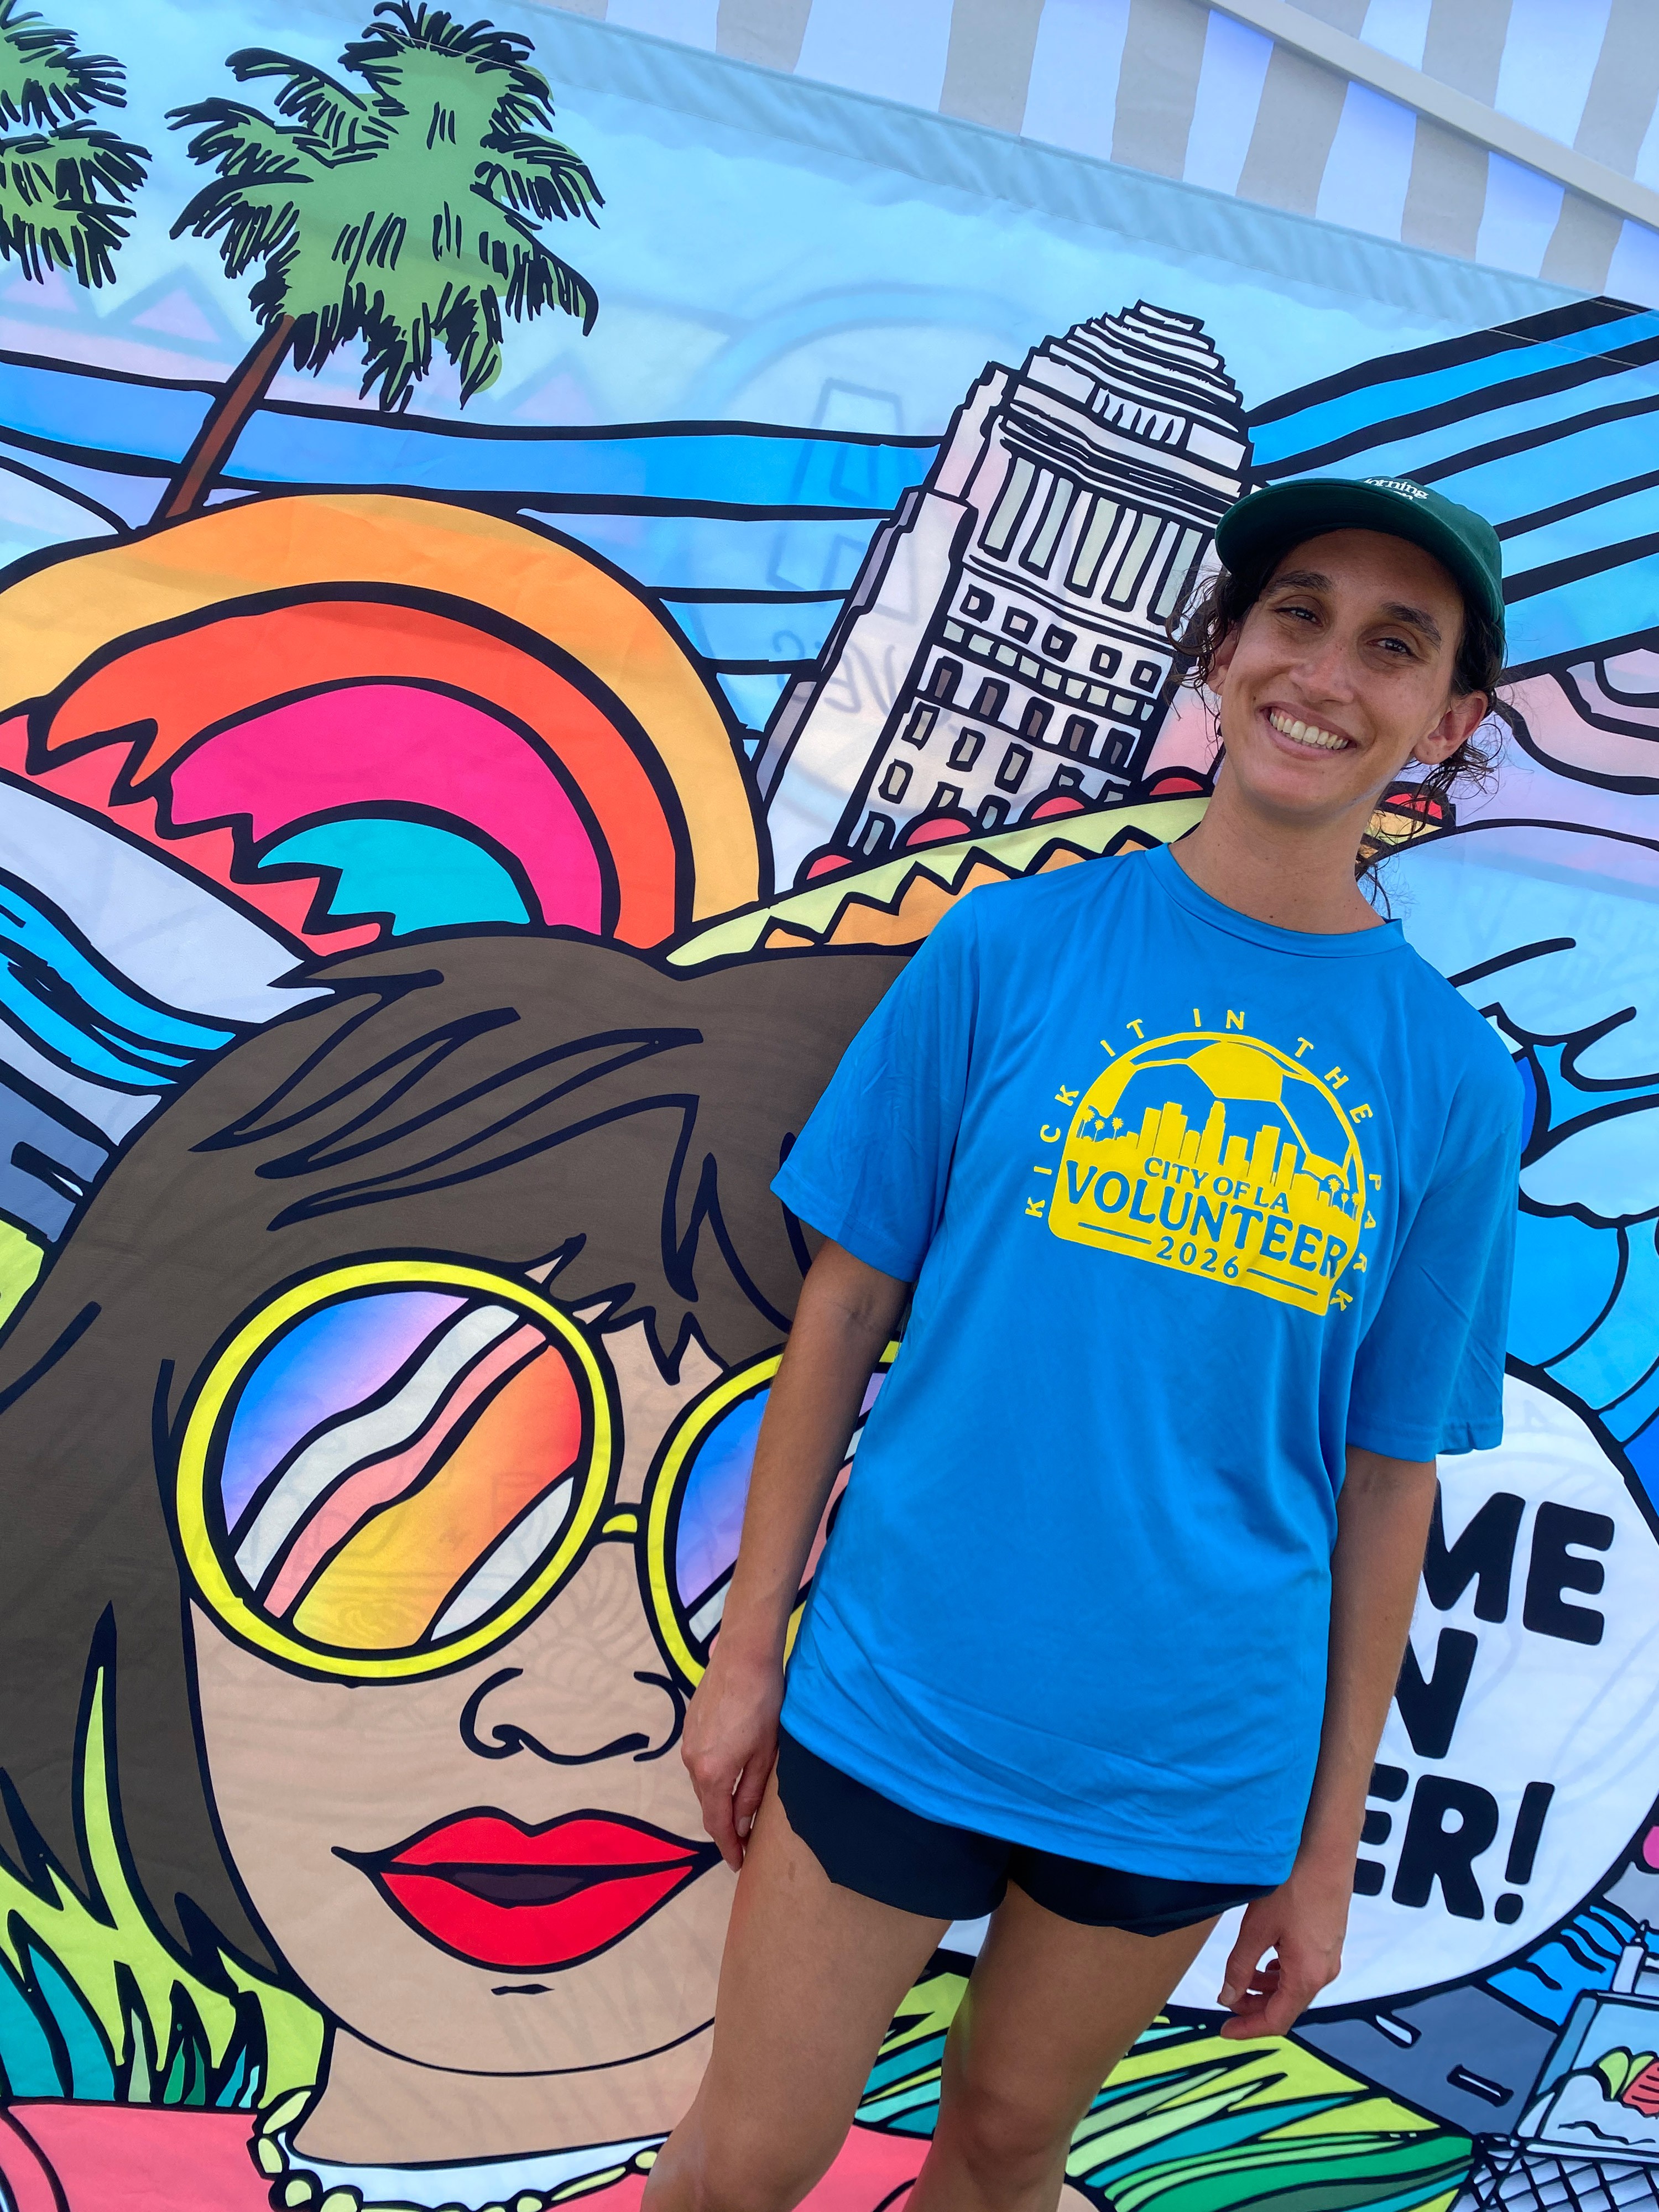
The team utilized volunteers to help collect data at Kick It in the Park. Volunteers worked the LA Loves tent and invited in park visitors to participate and have a discussion about their selections. As the volunteers themselves were Angelenos from across the city and county, this led to great conversations and lively debates about what Angelenos love and care about!
Parks: Cheviot Hills, Echo Park, Jackie Tatum Harvard Recreation Center, Westwood Recreation Center, Whitsett Fields
digitization procedure
Physical posters were photographed on-site and then digitized later for analysis. Each photograph was segmented into its constituent response regions (rows, boxes, quadrants, or radial wedges). Sticker counts were derived through a combination of AI analysis using computer vision to estimate sticker counts as well as manual visual inspection. In all instances, visual inspection was treated as authoritative where it diverged from automated output. Detected overlays were cross-checked against source photographs prior to finalization. Transcriptions of handwritten comments and write-ins were rendered verbatim where legible; uncertain readings are marked accordingly.
sampling considerations
The sample is self-selected and non-representative of the Los Angeles population at large. Respondents opted into participation by attending a free public event and engaging voluntarily.
About Data Vandals
How do you have a conversation with a city?
Data Vandals is a NYC art duo creating public installations, workshops, and participatory exhibitions that turn data into art and create participatory experiences in cities around the world.

Our artwork transforms data into experiences that invite curiosity and create conversations, turning passive observers into active participants.
Data Vandals is Jen Ray (artist) and Jason Forrest (dataviz expert). Driven by the conviction that meaningful change happens when art meets community, we have engaged thousands of people through exhibitions, performances, and workshops.
Instagram | LinkedIn | DataVandalsNYC@gmail.com
LA IMPACT TEAM
about the los angeles impact team
The Los Angeles Impact Team, housed at the Office of Strategic Partnerships in the Mayor's Office, is a team of strategists, designers, data analysts, and project managers who are invested in driving civic and cultural innovation for the Major Events.
Their goal is to execute the Mayor's 'Games for All' vision by using the Games as a catalyst for meaningful civic connection, partnerships, and community resilience.
